Leaflet地図:現在の積雪を地図表示。気象庁データを使用。JavaScript&PHP(CORS制限回避)。XAMPPでCA証明書。InfinityFree。
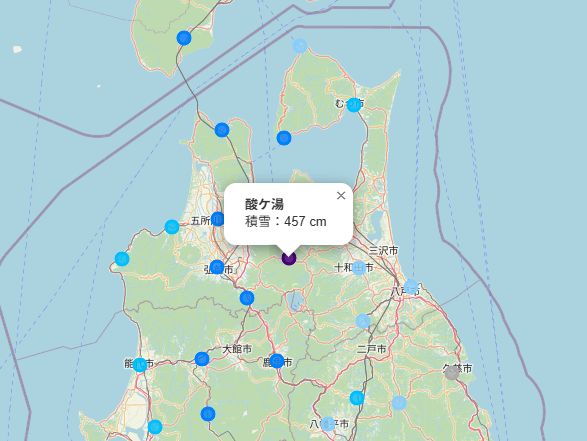
気象庁の「現在の積雪」データを使って、Leafletで地図表示するようにした。
■ 使用したデータ
《 気象庁:積雪観測地点情報(json)》
https://www.jma.go.jp/bosai/amedas/const/amedastable.json
《 気象庁:現在の積雪データ(csv)》
※ データは1時間毎に更新される。観測時から、2時間程遅れる可能性がある。
https://www.data.jma.go.jp/stats/data/mdrr/snc_rct/alltable/snc00_rct.csv
■ 作成したLeaflet地図Webページ
《 現在の積雪 by 気象庁アメダス 》(InfinityFree)
https://ok2nd.great-site.net/amedas/snow.html

■ プログラム補足
CORS制限を回避するため、サーバーサイドでPHPを使用。
「snc00_rct.csv」はShift-JISなので、UTF-8へ変換後、JSON形式でhtmlクライアントに渡す。
■ XAMPPでCA証明書を設定
今回のアプリをローカルPCのXAMPP上で検証するために、XAMPPでCA証明書を設定した。
気象庁のURLはすべてHTTPS。そのため、CA証明書が設定されていないと、HTTPS通信が拒否される。それを回避するために、XAMPPでCA証明書の設定をした。
※ (参考)自分のPCでの検証用URL
① CA証明書をダウンロード:公式(curl推奨)
② 保存先(例):フォルダがなければ作ってOK
- \xampp\php\extras\ssl\cacert.pem
③ \xampp\php\php.ini に、以下を追加。環境に合わせてパスを変更。この時点では、XAMPPをDドライブに入れている。
[curl]
curl.cainfo="D:\xampp\php\extras\ssl\cacert.pem"
[openssl]
openssl.cafile="D:\xampp\php\extras\ssl\cacert.pem"
④ C:\xampp\php\php.iniの以下のコメントアウトを外して、OpenSSLを有効にする。
;extension=php_openssl.dll
↓↓↓
extension=php_openssl.dll
⑤ コントロールパネルで、Apache を一旦停止して起動する。
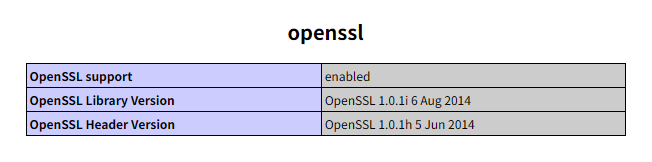
⑥ OpenSSLが有効になっていることの確認。
http://localhost/xampp/phpinfo.php
で、OpenSSL support が enabled になっていることを確認。
■ ソースコード
【snow.html】
<!DOCTYPE html>
<html lang="ja">
<head>
<meta charset="UTF-8">
<title>現在の積雪 by 気象庁アメダス</title>
<link
	rel="stylesheet"
	href="https://unpkg.com/leaflet@1.9.4/dist/leaflet.css"
/>
<style>
html, body, #map {
	height: 100%;
	margin: 0;
}
.legend {
	background: white;
	padding: 8px 10px;
	font: 12px/14px Arial, Helvetica, sans-serif;
	color: #333;
	box-shadow: 0 0 5px rgba(0,0,0,0.3);
	border-radius: 4px;
}
.legend i {
	width: 14px;
	height: 14px;
	float: left;
	margin-right: 6px;
	opacity: 0.9;
}
</style>
</head>
<body>
<div id="map"></div>
<script src="https://unpkg.com/leaflet@1.9.4/dist/leaflet.js"></script>
<script>
const map = L.map('map').setView([38.0, 138.0], 6);
L.tileLayer('https://{s}.tile.openstreetmap.org/{z}/{x}/{y}.png', {
	attribution: 'c OpenStreetMap'
}).addTo(map);
// 積雪量→色
function snowColor(cm) {
	if (cm >= 300) return '#4b0082';
	if (cm >= 200) return '#0000ff';
	if (cm >= 100) return '#0080ff';
	if (cm >= 50)	return '#00bfff';
	if (cm >= 10)	return '#87cefa';
	return '#aaa';
}
Promise.all([
	fetch('amedas_station.php').then(r => r.json()),
	fetch('amedas_snow.php').then(r => r.json())
]).then(([stations, snow]) => {
	let count = 0;
	for (const id in snow) {
		const st = stations[id];
		if (!st || !st.lat || !st.lon) continue;
		const lat = st.lat[0] + st.lat[1] / 60;
		const lon = st.lon[0] + st.lon[1] / 60;
		const cm	= snow[id];
		L.circleMarker([lat, lon], {
			radius: 6,
			color: snowColor(cm),
			fillColor: snowColor(cm),
			fillOpacity: 0.8
		})
		.bindPopup(
			`<b>${st.kjName}</b><br>積雪:${cm} cm`
		)
		.addTo(map);
		count++;
	}
	console.log('表示観測所数:', count);
}).catch(err => {
	console.error(err);
	alert('データ取得エラー(Console参照)');
});
/* ===== 凡例(積雪cm) ===== */
const legend = L.control({ position: 'bottomright' });
legend.onAdd = function (map) {
	const div = L.DomUtil.create('div', 'info legend');
	const grades = [0, 10, 50, 100, 200, 300];
	const labels = [];
	div.innerHTML += '<b>積雪(cm)</b><br>';
	for (let i = 0; i < grades.length; i++) {
		const from = grades[i];
		const to = grades[i + 1];
		div.innerHTML +=
			'<i style="background:' + snowColor(from + 1) + '"></i> ' +
			from + (to ? '–' + to : '+') + '<br>';
	}
		div.innerHTML +=
			'出典:気象庁(アメダス)';
	return div;
};
legend.addTo(map);
</script>
</body>
</html>
【amedas_station.php】
<?php
header('Content-Type: application/json; charset=UTF-8');
$url = 'https://www.jma.go.jp/bosai/amedas/const/amedastable.json';
$json = file_get_contents($url);
echo $json;
【amedas_snow.php】
<?php
error_reporting(E_ALL);
ini_set('display_errors', 1);
header('Content-Type: application/json; charset=UTF-8');
$url = 'https://www.data.jma.go.jp/stats/data/mdrr/snc_rct/alltable/snc00_rct.csv';
/* CSV取得 */
$csv = @file_get_contents($url);
if ($csv === false) {
	echo json_encode(array('error' => 'failed to get csv'));
	exit;
}
/* ?? 文字コード変換(超重要) */
$csv = mb_convert_encoding($csv, 'UTF-8', 'SJIS-win');
/* 行分割 */
$lines = explode("\n", $csv);
/*
  列番号(2025年現在)
  0: 観測所番号
  9: 現在の積雪(cm)
*/
$result = array();
foreach ($lines as $i => $line) {
	if ($i === 0) continue;		// ヘッダ行スキップ
	if (trim($line) === '') continue;
	$row = str_getcsv($line);
	if (!isset($row[0]) || !isset($row[9])) continue;
	$id   = trim($row[0]);
	$snow = trim($row[9]);
	if ($id !== '' && is_numeric($snow)) {
		$result[$id] = (float)$snow;
	}
}
echo json_encode($result, JSON_UNESCAPED_UNICODE);
Leaflet地図 リスト by 晴歩雨描ok2nd.github.io
